
Atavide: importing your data into R
This post is one of a multipart series about analysing your metagenomics samples with Atavide. It is intended to be a quick and dirty look at the superfocus output, how you can make it better, importing into R, and how you might go about some simple plots and tests.
Dependencies
For linux, you can install taxonkit from bioconda. Follow the documentation for installing or downloading the database.
conda install -c bioconda taxonkit
Install dependencies for R (Rstudio). You can do everything in base R, but these packages make things easier.
install.packages("dplyr")
install.packages("tidyr")
install.packages("ggplot2")
library(dplyr)
library(tidyr)
library(ggplot2)
ReadAnnotations/all_taxonomy.tsv (Superfocus output)
Look at the file (in Linux)
head all_taxonomy.tsv
Superkingdom|Phylum|Class|Order|Family|Genus|Species|Taxid      FAME000065      FAME000066      FAME000067      FAME000068      FAME000069      FAME000070      FAME000072      FAME000073   FAME000074       FAME000075      FAME000076      FAME000077      FAME000078      FAME000079      FAME000080      FAME000081      FAME000082
s:Archaea|p:Candidatus Korarchaeota|c:|o:|f:|g:Candidatus Korarchaeum|s:Candidatus Korarchaeum cryptofilum|taxid: 374847        1       0       0       1       2       0       0       1    10       0       0       0       0       2       0       0
s:Archaea|p:Crenarchaeota|c:Thermoprotei|o:Desulfurococcales|f:Desulfurococcaceae|g:Aeropyrum|s:Aeropyrum pernix|taxid: 272557  0       0       0       0       0       0       0       0    00       0       0       0       0       1       0       0
s:Archaea|p:Crenarchaeota|c:Thermoprotei|o:Desulfurococcales|f:Desulfurococcaceae|g:Ignicoccus|s:Ignicoccus hospitalis|taxid: 453591    0       0       0       2       0       0       0    00       2       0       0       0       0       0       0       0
s:Archaea|p:Crenarchaeota|c:Thermoprotei|o:Desulfurococcales|f:Desulfurococcaceae|g:Staphylothermus|s:Staphylothermus marinus|taxid: 399550     1       0       0       0       0       1    00       1       2       0       0       0       0       0       0       0
s:Archaea|p:Crenarchaeota|c:Thermoprotei|o:Desulfurococcales|f:Pyrodictiaceae|g:Hyperthermus|s:Hyperthermus butylicus|taxid: 415426     0       1       0       1       0       0       0    00       0       0       0       0       0       0       0       0
s:Archaea|p:Crenarchaeota|c:Thermoprotei|o:Sulfolobales|f:Sulfolobaceae|g:Sulfolobus|s:Sulfolobus acidocaldarius|taxid: 330779  0       0       0       0       0       0       0       0    00       0       1       0       0       0       1       0
s:Archaea|p:Crenarchaeota|c:Thermoprotei|o:Sulfolobales|f:Sulfolobaceae|g:Sulfurisphaera|s:Sulfurisphaera tokodaii|taxid: 273063        0       0       0       0       0       0       1    00       0       0       0       0       0       0       0       0
s:Archaea|p:Crenarchaeota|c:Thermoprotei|o:Thermoproteales|f:Thermofilaceae|g:Thermofilum|s:Thermofilum pendens|taxid: 368408   0       1       1       0       2       1       2       2    00       0       0       0       0       0       1       0
s:Archaea|p:Crenarchaeota|c:Thermoprotei|o:Thermoproteales|f:Thermoproteaceae|g:Caldivirga|s:Caldivirga maquilingensis|taxid: 397948    2       0       0       0       0       0       0    00       0       0       0       0       0       0       0       2
tail all_taxonomy.tsv
s:|p:Uroviricota|c:Caudoviricetes|o:Caudovirales|f:Siphoviridae|g:|s:Streptococcus phage phi3396|taxid: 423476  0       4       0       25      228     6       3       65      0       7    10       0       11      0       6       0
s:|p:Uroviricota|c:Caudoviricetes|o:Caudovirales|f:Siphoviridae|g:|s:Streptomyces phage VWB|taxid: 10702        0       2       1       30      146     0       0       0       0       0    80       0       0       0       0       36      0
s:|p:Uroviricota|c:Caudoviricetes|o:Caudovirales|f:Siphoviridae|g:|s:Streptomyces phage mu1/6|taxid: 370623     0       0       0       1       0       0       0       0       0       0    00       1       0       0       0       0
s:|p:Uroviricota|c:Caudoviricetes|o:Caudovirales|f:Siphoviridae|g:|s:Temperate phage phiNIH1.1|taxid: 173707    9       105     25      252     404     163     40      915     1       170  90       18      0       0       67      8
s:|p:Uroviricota|c:Caudoviricetes|o:Caudovirales|f:Siphoviridae|g:|s:Yersinia phage PY54|taxid: 172667  0       0       0       1       1       0       1       0       0       2       0    00       1       0       0       1
s:|p:Uroviricota|c:Caudoviricetes|o:Caudovirales|f:|g:|s:Enterobacteria phage P4|taxid: 10680   1       3       0       0       0       0       1       0       2       0       0       0    10       0       1       0
s:|p:Uroviricota|c:Caudoviricetes|o:Caudovirales|f:|g:|s:Streptococcus phage 315.5|taxid: 198542        6       19      123     60      159     8       1       14      70      82      4    15       0       1       0       9       1
s:|p:|c:|o:|f:|g:|s:Phage Gifsy-1|taxid: 129861 0       0       0       0       1       0       0       0       0       0       0       0       1       0       0       0       0
s:|p:|c:|o:|f:|g:|s:Phage Gifsy-2|taxid: 129862 0       0       0       0       0       0       0       0       0       8       0       0       0       0       1       0       0
s:|p:|c:|o:|f:|g:|s:Salmonella phage Fels-1|taxid: 128975
ewww.
It’s a weird format table but the first thing we need to fix is the missing taxonomic information. We use Taxonkit for this.
sed 's/.*taxid: //' ReadAnnotations/all_taxonomy.tsv \
  | taxonkit lineage -i 1 --data-dir ~/data/git/hecatomb/databases/tax/taxonomy/ \
  | taxonkit reformat --data-dir ~/data/git/hecatomb/databases/tax/taxonomy/ -i 19 -f "{k}\t{p}\t{c}\t{o}\t{f}\t{g}\t{s}" -F --fill-miss-rank \
  | cut --complement -f1,19 \
  > all_tax_fixed.tsv
There’s a lot going on here so lets break it down. Sed is stripping everything but the taxid number from the first column. taxonkit lineage is translating the taxid into a taxonomy (delimited with ‘;’) and adding it to the end of each line (column 19). taxonkit reformat is reading in the taxonomy (column 19), filling in any missing fields, and outputing in a tab separated format (columns 20 onwards). We dont need columns 1 (tax IDs) and 19 (default format taxonomy with missing fields), so we remove them using Cut.
For taxonkit, make sure you’ve either installed the databases, or downloaded them somewhere so you can point to them with --data-dir (or just use my folder on deepthought).
head all_tax_fixed.tsv
FAME000065      FAME000066      FAME000067      FAME000068      FAME000069      FAME000070      FAME000072      FAME000073      FAME000074      FAME000075      FAME000076      FAME000077   FAME000078       FAME000079      FAME000080      FAME000081      FAME000082
31      42      11      33      138     50      7       133     34      58      22      21      6       22      18      15      4       Archaea Candidatus Korarchaeota unclassified Candidatus Korarchaeota class    unclassified Candidatus Korarchaeota order      unclassified Candidatus Korarchaeota family     Candidatus Korarchaeum  Candidatus Korarchaeum cryptofilum
8       9       2       8       22      9       5       2       29      30      8       0       11      27      41      4       2       Archaea Crenarchaeota   Thermoprotei    Desulfurococcales     Desulfurococcaceae      Aeropyrum       Aeropyrum pernix
2       9       0       0       2       0       0       1       3       5       2       0       1       2       7       2       0       Archaea Crenarchaeota   Thermoprotei    Desulfurococcales     Desulfurococcaceae      Desulfurococcus Desulfurococcus amylolyticus
11      3       8       20      38      11      3       11      13      29      4       3       0       12      8       7       14      Archaea Crenarchaeota   Thermoprotei    Desulfurococcales     Desulfurococcaceae      Ignicoccus      Ignicoccus hospitalis
115     32      39      69      250     49      74      10      69      153     46      24      48      31      25      35      26      Archaea Crenarchaeota   Thermoprotei    Desulfurococcales     Desulfurococcaceae      Staphylothermus Staphylothermus marinus
60      15      16      31      74      20      23      6       53      58      26      3       30      29      8       6       10      Archaea Crenarchaeota   Thermoprotei    Desulfurococcales     Pyrodictiaceae  Hyperthermus    Hyperthermus butylicus
36      3       12      23      50      11      7       15      33      30      7       14      3       5       9       9       17      Archaea Crenarchaeota   Thermoprotei    Sulfolobales Sulfolobaceae    Metallosphaera  Metallosphaera sedula
4       0       2       2       7       0       0       0       3       12      8       0       0       3       4       3       1       Archaea Crenarchaeota   Thermoprotei    Sulfolobales Sulfolobaceae    Saccharolobus   Saccharolobus solfataricus
3       0       6       8       20      6       0       1       1       21      2       5       1       27      11      56      4       Archaea Crenarchaeota   Thermoprotei    Sulfolobales Sulfolobaceae    Sulfolobus      Sulfolobus acidocaldarius
The file is missing the header information for the new taxonomy fields, so we can fix that before importing into R, or after importing into R. You can open it up in a text editor and do it manually, adding in tabs to separate the header fields. The last sample name is ‘FAME000082’ so I’ll just use sed.
sed 's/FAME000082\t/FAME000082\tKingdom\tPhylum\tClass\tOrder\tFamily\tGenus\tSpecies/' all_tax_fixed.tsv > all_tax_final.tsv
Read the file into R (assuming you’ve downloaded it)
data = read.csv("all_taxonomy.tsv",header=T,sep="\t")
View(data)
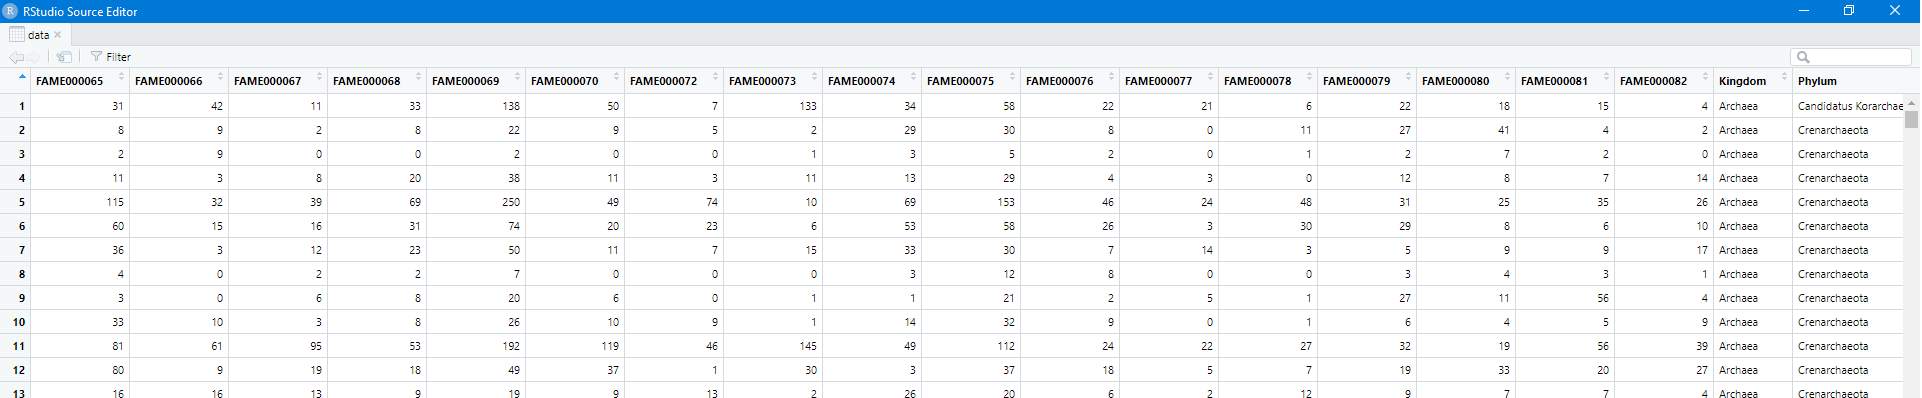
At the moment this is a wide table, and I prefer to work in long table format.
The samples are in columns 1 to 18 (R is 1-indexed).
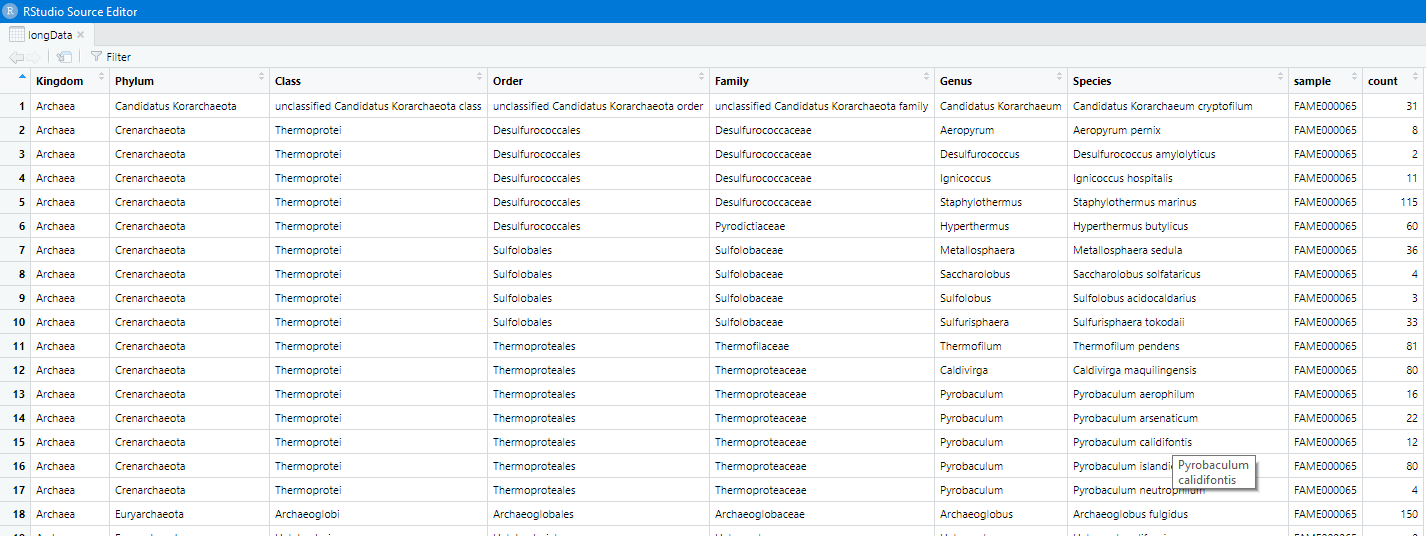
We want to have a column for the tax information, a column for the sample, and a column for the number.
Use the tidyr function gather() to convert the table.
longData = gather(data, "sample", "count", 1:17)
View(longData)
Let’s add some metadata, first add it in as a data frame, you can read it in from a file or past in the raw text. NOTE: R will read the group numbers in the table below into numerical values, which is fine until we go to plot. We want R to treat them as categories, so we need to coerce them into character strings.
meta = read.table(text = "sample,group
FAME000065,1
FAME000066,1
FAME000067,1
FAME000068,1
FAME000069,1
FAME000070,1
FAME000072,1
FAME000073,1
FAME000074,1
FAME000075,2
FAME000076,2
FAME000077,2
FAME000078,2
FAME000079,2
FAME000080,2
FAME000081,2
FAME000082,2",sep=',',header=T)

meta$group = as.character(meta$group)
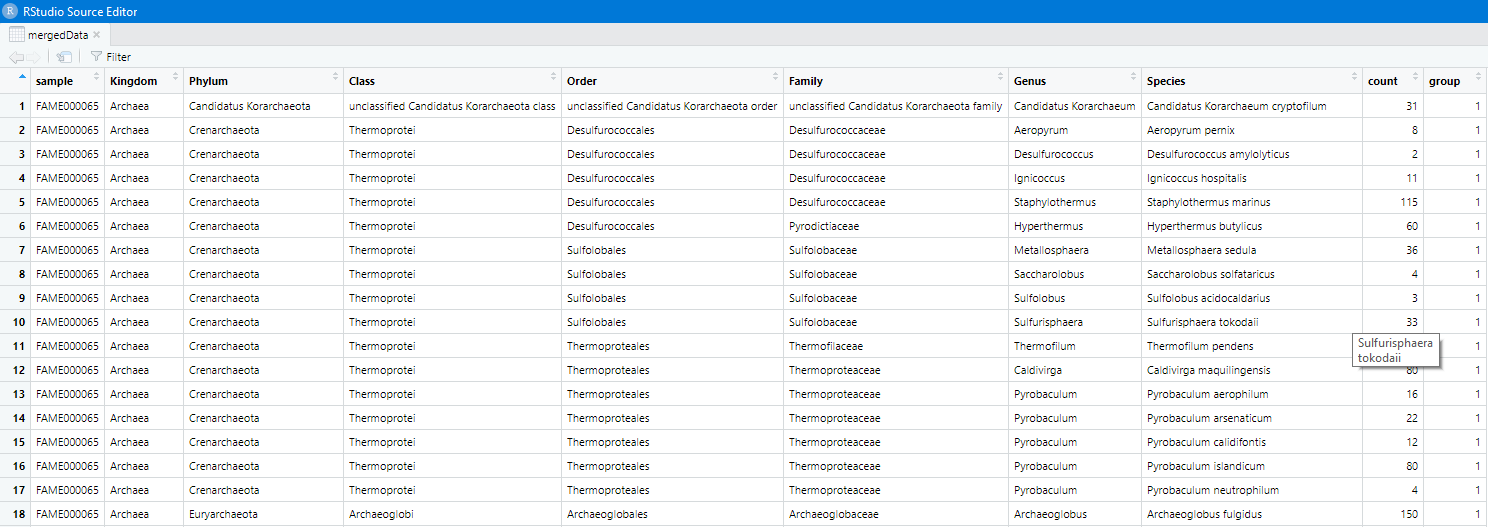
Merge it with our taxonomy table
mergedData = merge(longData, meta, by='sample')

View(mergedData)
Let’s plot the counts of each sample for each phyla, colored by their group.
ggplot(mergedData)+geom_point(aes(y=Phylum,x=count,color=group))

It looks like Firmicutes might be interesting, let’s just plot that for both groups.
The example below is a base-R method for slicing dataframes.
mergedData$Phylum=='Firmicutes' will return a list of True or False,
which can be used to specify which rows we want from mergedData.
firmSub = mergedData[mergedData$Phylum=='Firmicutes',]
ggplot(firmSub)+geom_boxplot(aes(x=group,y=count),width=0.1)+scale_y_log10()
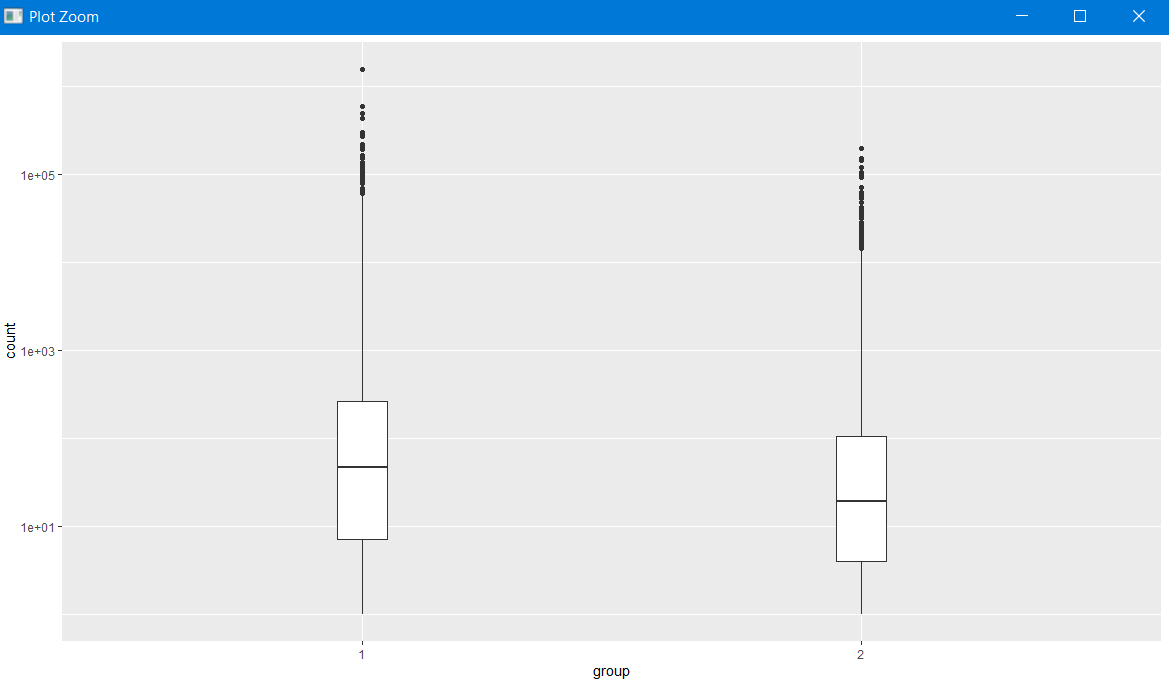
This shows one point per species, only showing the Firmicutes species. Let’s sum all the Firmicutes counts for each sample.
FirmSum = mergedData %>% dplyr::filter(Phylum == "Firmicutes") %>% group_by(sample) %>% summarise(sum(count))
FirmSum = merge(FirmSum, meta, by = 'sample')
colnames(FirmSum) = c('sample','count','group')
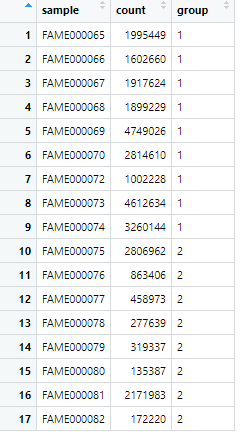
We refilter (to show the dplyr way to filter), group by sample, and use the summarise function to sum the counts for each sample. We then add the metadata back in for plotting and fix the header.
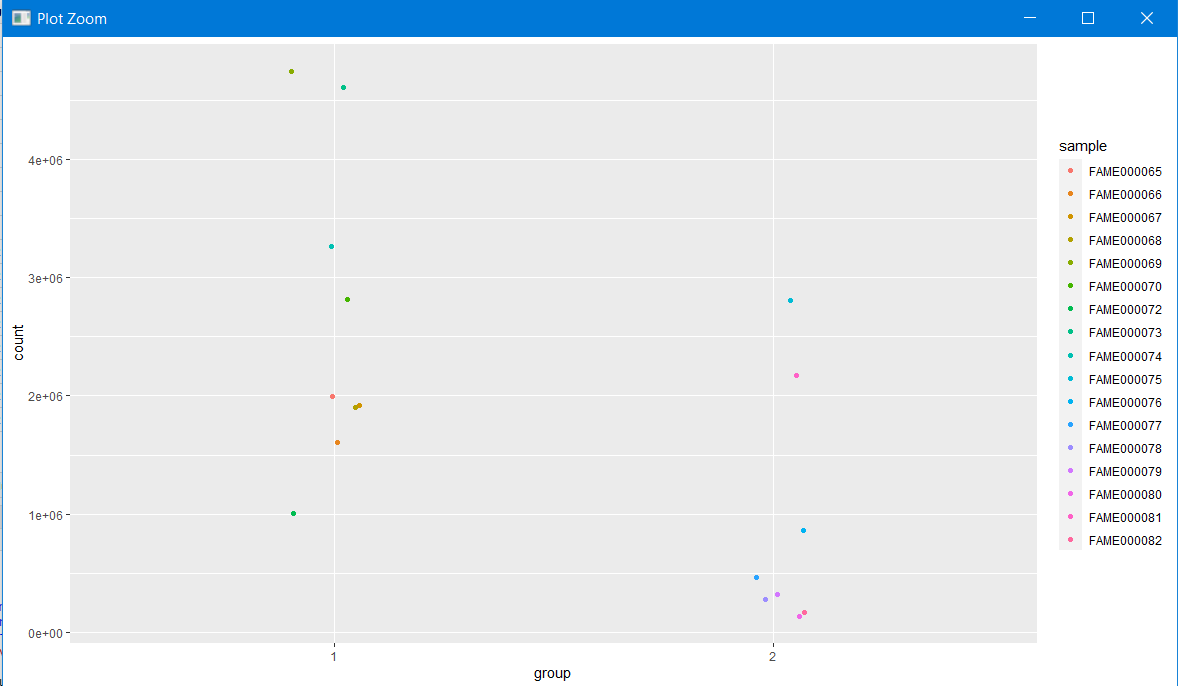
ggplot(FirmSum)+geom_jitter(aes(x=group,y=count,color=sample),width=0.1)
Is it significant? Lets do a simple t-test
t.test(FirmSum[FirmSum$group=='1',]$count, FirmSum[FirmSum$group=='2',]$count)
	Welch Two Sample t-test

data:  FirmSum[FirmSum$group == "1", ]$count and FirmSum[FirmSum$group == "2", ]$count
t = 3.0711, df = 14.745, p-value = 0.007889
alternative hypothesis: true difference in means is not equal to 0
95 percent confidence interval:
  533509 2965815
sample estimates:
mean of x mean of y
2650400.4  900738.4